Tech we'll be using
- Mapbox GL JS
- A fantastic library for creating maps
- GeoJSON NPM package
- A package for working with GeoJSON
- csvtojson NPM package
- A package for converting CSV to JSON
Where do you get weather station data from?
In Australia, we have a government organisation called the BOM (Bureau of Meteorology) which publishes a group of CSV files of weather stations.
Fixing up the data
This data is pretty raw with no headers and looks like this:
st,300000,300 ,DAVIS                                   ,01/1957,       ,-68.5744,  77.9672,GPS            ,ANT,  18.0,  23.2,89571,1957,2010,   , 98,  2,  0,  *,  *,#
st,300001,300 ,MAWSON                                  ,01/1954,       ,-67.6017,  62.8753,GPS            ,ANT,   9.9,  16.0,89564,1954,2010,   , 98,  2,  0,  *,  *,#
st,300002,300 ,TAYLOR ROOKERY                          ,01/1957,12/1958,-67.4500,  60.8667,               ,ANT,   3.0,      ,     ,1957,1959,   ,100,  0,  0,  0,  0,#
st,300003,300 ,WILKES                                  ,01/1959,12/1969,-66.2500, 110.5833,               ,ANT,  12.0,  13.0,     ,1960,1969,   , 99,  0,  0,  0,  *,#
st,300004,300 ,MACQUARIE ISLAND                        ,01/1948,       ,-54.4994, 158.9369,SURVEY         ,ANT,   6.0,   8.3,94998,1948,2010,   , 99,  1,  0,  *,  *,#
st,300005,300 ,HEARD ISLAND (ATLAS COVE)               ,01/1948,       ,-53.0190,  73.3918,GPS            ,ANT,   3.0,   3.5,95997,1948,1987,   ,100,  0,  0,  0,  0,#
st,300006,300 ,CASEY (THE TUNNEL)                      ,01/1969,01/1989,-66.2833, 110.5333,               ,ANT,  12.0,  15.0,     ,1969,1990,   ,100,  0,  0,  0,  0,#
st,300007,300 ,MOUNT CRESSWELL                         ,01/1972,02/2003,-72.7333,  64.3833,               ,ANT,1161.3,1300.0,     ,1971,1974,   ,100,  0,  0,  0,  0,#
st,300008,300 ,MOORE PYRAMID                           ,01/1972,12/1984,-70.3000,  65.1000,               ,ANT,1460.0,      ,     ,1972,1974,   ,100,  0,  0,  0,  0,#
st,300009,300 ,KNUCKEY PEAKS                           ,01/1975,12/1984,-67.8000,  53.5000,               ,ANT,      ,      ,     ,1974,1975,   ,100,  0,  0,  0,  0,#
st,300010,300 ,MOUNT KING                              ,01/1975,12/1984,-67.1000,  52.5000,               ,ANT, 112.5,      ,     ,1979,1980,   ,100,  0,  0,  0,  0,#
st,300011,300 ,LANYON JUNCTION                         ,01/1983,12/1987,-66.3000, 110.8667,               ,ANT, 470.0,      ,     ,1984,1985,   ,100,  0,  0,  0,  0,#
Using the informataion in this mws_notes.txt http://www.bom.gov.au/climate/how/newproducts/images/mws_notes.txt I
was able to work out the header line for the CSV.
Record identifier - st,Bureau of Meteorology Station Number.,Rainfall district code,Station Name.,Month/Year site opened. (MM/YYYY),Month/Year site closed. (MM/YYYY),Latitude to 4 decimal places in decimal degrees,Longitude to 4 decimal places in decimal degrees,Method by which latitude/longitude was derived.,State.,Height of station above mean sea level in metres.,Height of barometer above mean sea level in metres.,WMO (World Meteorological Organisation) Index Number.,First year of data supplied in data file.,Last year of data supplied in data file.,Percentage complete between first and last records.,Percentage of values with quality flag 'Y'.,Percentage of values with quality flag 'N'.,Percentage of values with quality flag 'W'.,Percentage of values with quality flag 'S'.,Percentage of values with quality flag 'I # symbol end of record indicator.,#
st,300000,300 ,DAVIS                                   ,01/1957,       ,-68.5744,  77.9672,GPS            ,ANT,  18.0,  23.2,89571,1957,2010,   , 98,  2,  0,  *,  *,#
Converting to JSON
I can now turn this file in to JSON using the csvtojson package.
npx csvtojson ws_stations/ws_stations_VIC.csv > ws_stations/ws_stations_VIC.json
This gives me a nice JSON file with the following structure:
[
  {
    "Record identifier - st": "st",
    "Bureau of Meteorology Station Number.": "076026",
    "Rainfall district code": "76",
    "Station Name.": "MERBEIN CSIRO RESEARCH STATION",
    "Month/Year site opened": {
      " (MM/YYYY)": "01/1920"
    },
    "Month/Year site closed": {
      " (MM/YYYY)": "08/1992"
    },
    "Latitude to 4 decimal places in decimal degrees": -34.2133,
    "Longitude to 4 decimal places in decimal degrees": 142.04,
    "Method by which latitude/longitude was derived.": "",
    "State.": "VIC",
    "Height of station above mean sea level in metres.": "56.4",
    "Height of barometer above mean sea level in metres.": "",
    "WMO (World Meteorological Organisation) Index Number.": "",
    "First year of data supplied in data file.": "1965",
    "Last year of data supplied in data file.": "1975",
    "Percentage complete between first and last records.": "",
    "Percentage of values with quality flag 'Y'.": "100",
    "Percentage of values with quality flag 'N'.": "0",
    "Percentage of values with quality flag 'W'.": "0",
    "Percentage of values with quality flag 'S'.": "0",
    "Percentage of values with quality flag 'I # symbol end of record indicator.": "0",
    "#": "#"
  }
]
I realise these JSON keys are wordy, but hey, we're scripting here, it'll be fine.
I will do some cleanup to map the latitudes and longitudes to more terse keys lat and lng
Now our JSON looks like this:
[
  {
    "Record identifier - st": "st",
    "Bureau of Meteorology Station Number.": "076026",
    "Rainfall district code": "76",
    "Station Name.": "MERBEIN CSIRO RESEARCH STATION",
    "Month/Year site opened": {
      " (MM/YYYY)": "01/1920"
    },
    "Month/Year site closed": {
      " (MM/YYYY)": "08/1992"
    },
    "lat": -34.2133,
    "lng": 142.04,
    "Method by which latitude/longitude was derived.": "",
    "State.": "VIC",
    "Height of station above mean sea level in metres.": "56.4",
    "Height of barometer above mean sea level in metres.": "",
    "WMO (World Meteorological Organisation) Index Number.": "",
    "First year of data supplied in data file.": "1965",
    "Last year of data supplied in data file.": "1975",
    "Percentage complete between first and last records.": "",
    "Percentage of values with quality flag 'Y'.": "100",
    "Percentage of values with quality flag 'N'.": "0",
    "Percentage of values with quality flag 'W'.": "0",
    "Percentage of values with quality flag 'S'.": "0",
    "Percentage of values with quality flag 'I # symbol end of record indicator.": "0",
    "#": "#"
  }
]
Converting to GeoJSON
Time to hop into the frontend. We'll read in this JSON file and use the Geojson library to create a GeoJSON FeatureCollection object filled with points.
We'll tell it that we want to parse the JSON as a collection of Points and that it can find the coordinates under the lat and lng keys.
import GeoJSON from "geojson";
import stations from "../ws_stations/ws_stations_VIC.json";

const geojsonWeatherStations = GeoJSON.parse(stations, {
  Point: ["lat", "lng"],
});
export default geojsonWeatherStations;
If you're not familiar with GeoJSON, you can read about it here.
Our JSON has now been parsed and turned into GeoJSON. It looks like this:
{
  "type": "FeatureCollection",
  "features": [
    {
      "type": "Feature",
      "geometry": {
        "type": "Point",
        "coordinates": [142.04, -34.2133]
      },
      "properties": {
        "Record identifier - st": "st",
        "Bureau of Meteorology Station Number.": "076026",
        "Rainfall district code": "76",
        "Station Name.": "MERBEIN CSIRO RESEARCH STATION",
        "Month/Year site opened": {
          " (MM/YYYY)": "01/1920"
        },
        "Month/Year site closed": {
          " (MM/YYYY)": "08/1992"
        },
        "Method by which latitude/longitude was derived.": "",
        "State.": "VIC",
        "Height of station above mean sea level in metres.": "56.4",
        "Height of barometer above mean sea level in metres.": "",
        "WMO (World Meteorological Organisation) Index Number.": "",
        "First year of data supplied in data file.": "1965",
        "Last year of data supplied in data file.": "1975",
        "Percentage complete between first and last records.": "",
        "Percentage of values with quality flag 'Y'.": "100",
        "Percentage of values with quality flag 'N'.": "0",
        "Percentage of values with quality flag 'W'.": "0",
        "Percentage of values with quality flag 'S'.": "0",
        "Percentage of values with quality flag 'I # symbol end of record indicator.": "0",
        "#": "#"
      }
    }
  ]
}
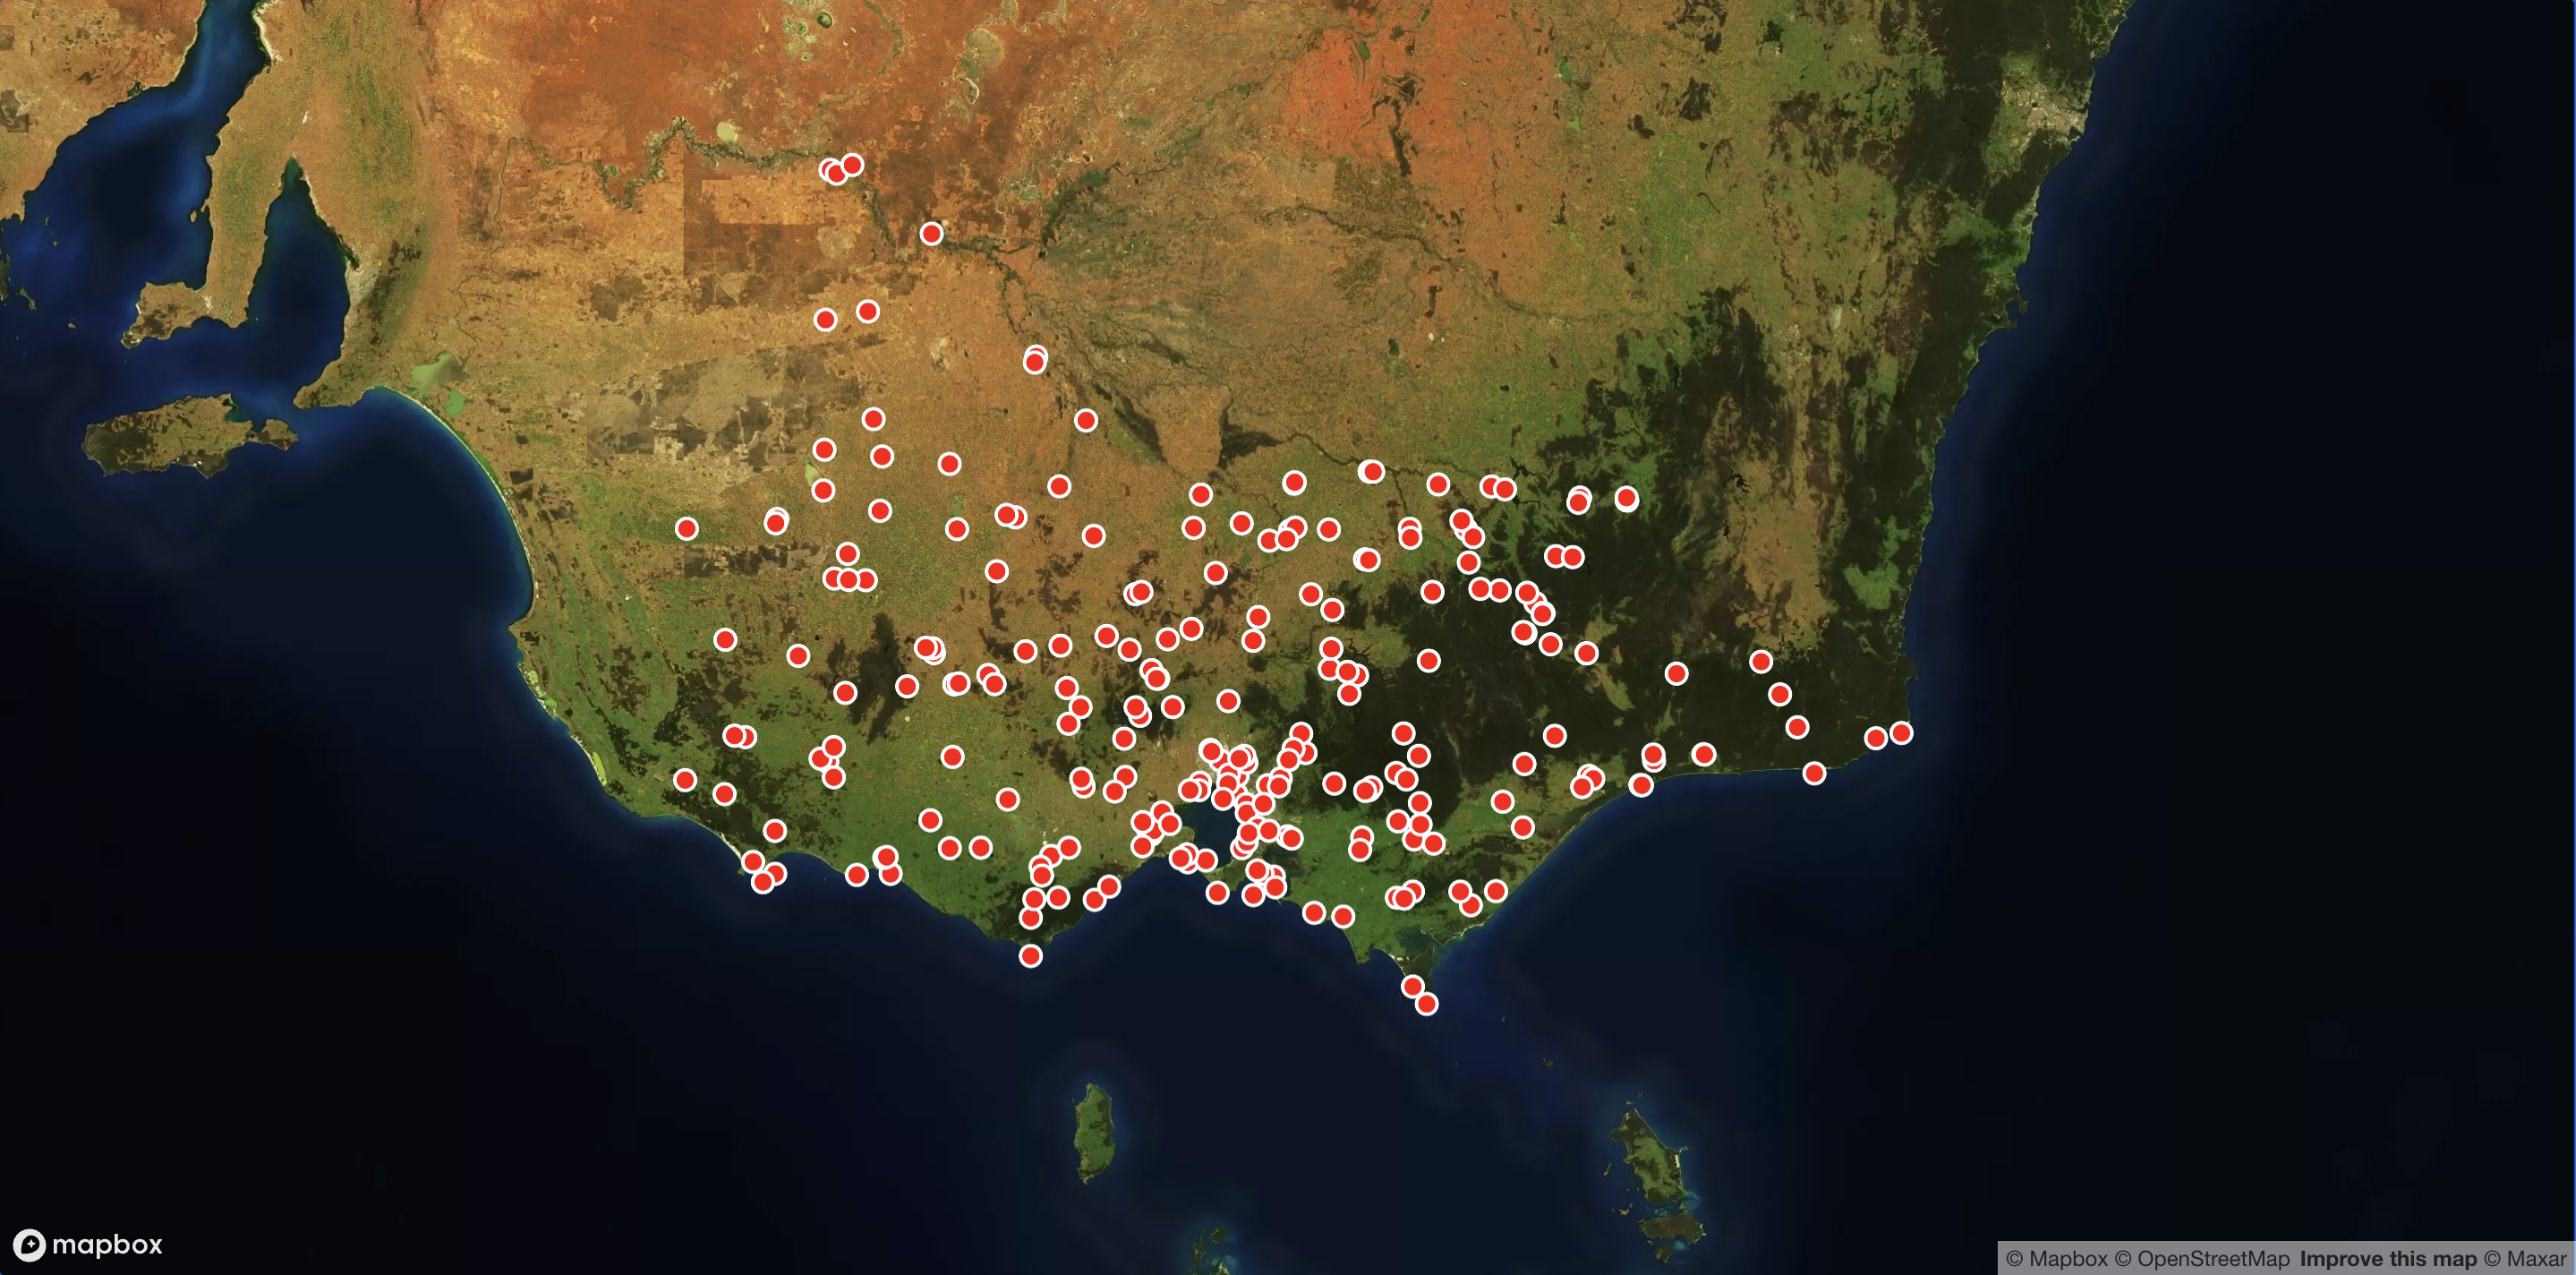
Adding a layer to the map
We can now add this GeoJSON to our mapbox map as a layer and style it with a simple circle style.
import weatherStationData from "./weatherStationData"; //<-- our GeoJSON
import map from "./mapbox-map"; //<-- the mapbox instance

map.addLayer({
  source: {
    type: "geojson",
    data: weatherStationData,
  },
  type: "circle",
  id: "weather-stations",
  paint: {
    "circle-radius": 5,
    "circle-color": "#FF0000",
    "circle-stroke-color": "#FFFFFF",
    "circle-stroke-width": 2,
  },
});
This is all that's needed to add a GeoJSON layer to our map.
From here we could add some interative features like a popup to show the station name and other details, or a filter to show only stations in a particular district but we'll cover that in a different article.