As developers, we tend to like to optimise our processes, including debugging issues.
In the front-end development world, its possible to ship an asset called a sourcemap along with your bundled, mangled and minified code.
This asset helps map our mangled and unreadable code back to the code we are familiar with in our code editors.
But, life is not always easy. Sometimes you have to debug an issue in production where you’ve not shipped your sourcemaps and its not reproducible locally.

So how do I figure out what part of the code is going wrong?
Stacktraces
I start with a stacktrace. When an unhandled error gets thrown in the application, a error message and stacktrace will prints to my browser console. You'll see this printed red.
In computing, a stack trace (also called stack backtrace or stack traceback) is a report of the active stack frames at a certain point in time during the execution of a program. - wikipedia
I take note of the message, usually something like Cannot read property ‘x’ of undefined.
Then I look at the top line of the stack trace. Click the link with the line numbers in it. This will take me to the last line of code to executed before the error got thrown.
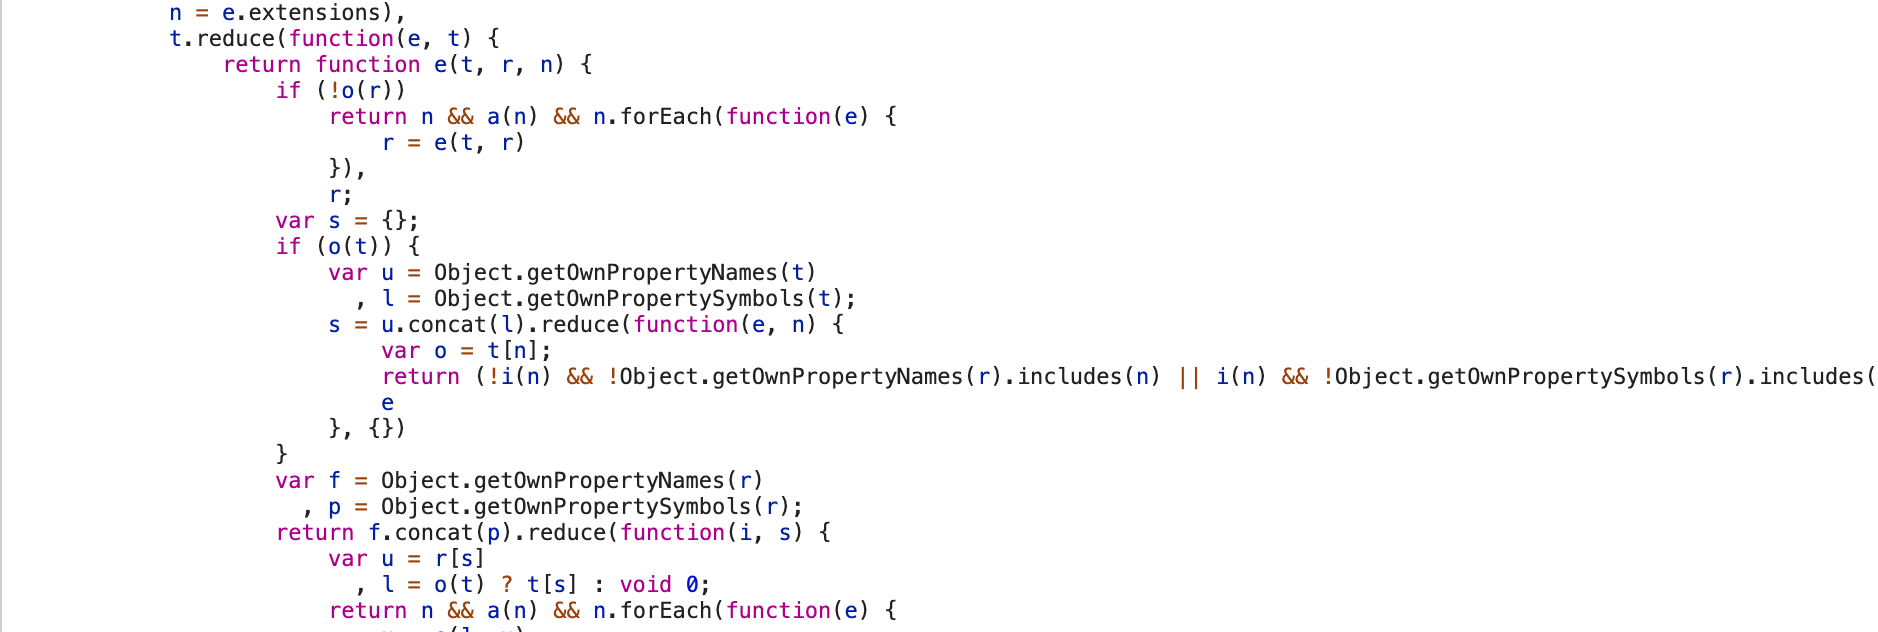
The diamond in the rough I'm looking for will be among a mess of jumbled characters. I'll look for the error reported in the stacktrace. In my case, a.x is visible in the highlighted area, I know I need to understand why a is undefined.
I now understand that I'm trying to pluck x off an object which got mangled to the variable a.
To make life easier, there is a pretty print button {} at the bottom of the Chrome Dev Tools. This will restore some sort of formatting to the jumbled mess of code.

Having clicked that, I'm now looking at some code that starts to resemble the code I wrote. As the variable names are incorrect, how do I find the place in the codebase where the issue is appearing?

Top Tip: property names and strings do not get mangled during minification.
This gives me some markers which link back to the original code. I’ll also often scan around the area to see the “shape” of code surrounding it.
Are there:
-
iteration loops before or after the problem area
-
inline functions
-
code branches via if statements
-
return statements.
One thing to note is where the undefined object is coming from. It may be a function parameter or returned from a function call etc.
Code searching
So I've looked around, found a few strings and property names that could lead me to the issue in the codebase.
Its time to hop into the code editor and start doing some global searches.
I’ll start by searching for one of the strings that look like they could be somewhat unique. Chances are I'll have many results and that’s where the second half of the detective work comes in.
I'll go through the results one by one, looking for the markers I took note of before.
Does the parent function have the same arity, are there loops in similar places as the minified code? Is the function returning the same type of things? Are there any property names you took note of earlier around the search result?
I may find two or more similar options so I'll then compare and contrast them with the stacktrace and the minified code.
Is there anything unique about them that I can look for in the code and find in the minifed code?
When I've narrowed it down to the place in the code where I'm sure the issue is. Its time to write a test and see if we can make the same error appear.
If I'm successful, I'll fix up the code. I'll then make my test pass. I'll run it up in the browser to make sure I've not affected current functionality and ship it off to our CI process.
